Traffic report
Description
The traffic report provides data on profile traffic from sources such as channels, web forms, pixels, and pop-ups. You can group the data according to certain attributes, drill down into the report, or use filters to exclude redundant information. It is also possible to compare the data to see how switching to a different strategy have affected your performance metrics.
The report is based on hit. It is a unit of traffic measurement. A hit is logged when a user action on a website or mobile application sends a request to the server. The action can be a goal registration or a click in a message.
Report settings
Traffic report settings include:
- grouping data,
- adding filters
- saving the report.
On the right you can see the following buttons:
![]() List of reports —
open the list of ready reports;
List of reports —
open the list of ready reports;
![]() Export report —
download the report in csv or xlsx formats;
Export report —
download the report in csv or xlsx formats;
![]() Assigned groups —
assign access groups
Assigned groups —
assign access groups
Grouping data
The report provides data on the following traffic sources:
- Channels. Statistics on subscriptions and unsubscribes, opens and clicks in messages.
- Pixels. Statistics on goals that are registered by pixels.
- Forms. Statistics onthe number of loads and submissionsof web forms.
- Pop-ups. Statistics on pop-ups shows and fills.
To get data for a specific traffic source, select it in the Report by field.
Next, set a period. You can specify the date range in the calendar manually or choose one of the presets.

Select the attribute by which you want to group the data in the report. After that, you can detail the grouping by selecting the attributes one by one in the "in which to show" field. Grouping is possible up to three levels. You will see the grouping options in the window on the right:
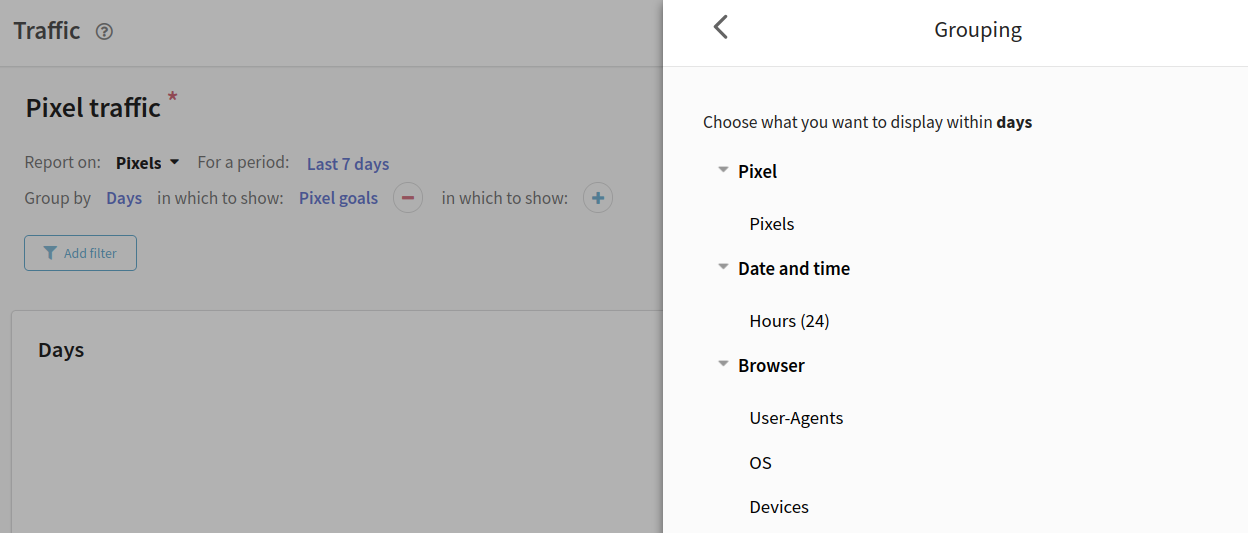
Not all browsers send responses specifying the device, browser, and operating system in the header. Groupings by "Device", "OS" and "User Agent" contain "Other" for such cases. Also if a header was transmitted, but the system could not read it, then information about the event will be recorded in "Other".
Adding filters
With the help of filters, you can leave only the necessary information in the report. Use filters if you want to view data by specific forms, goals, resources, etc. Filter categories are the same as grouping categories.
Сlick Add filter to filter the data. In the window on the right, you can choose which data to include in the report.
If you need to remove some data from the report, click on the Exclude switch in the upper right corner.
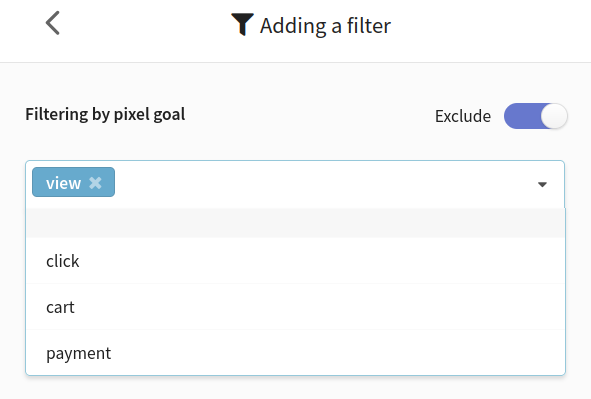
After setting the filter, click Apply at the bottom of the page.
The added filters will be displayed in the report. There is no limit to the number of filters you can use. Click  to remove the filter.

Saving a report
You can save the current report settings. To do this, edit the name of the report (the default is "All Channels") and click the "Save" button. This is useful if you frequently query data using the same groupings and filters.
The saved report will be available to all users within group visibility.
Click  to open the list of reports. In a new window you will find default (system) and saved reports. Click on the name of the report to view it.
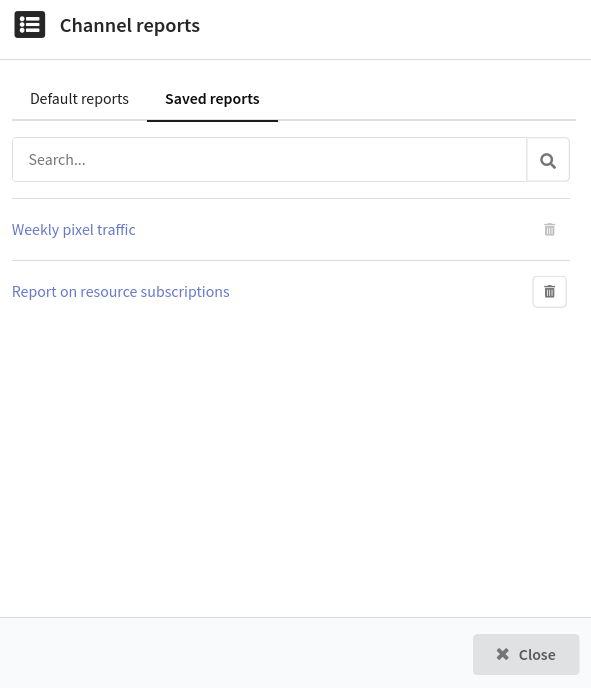
To delete a saved report, click  . However, you cannot delete the report that you are currently viewing.
Viewing a report
The report includes a table with data and a corresponding diagram. The chart can be collapsed by clicking on the Hide diagram button.
Diagram
The chart displays data based on grouping. When the report is grouped by days, weeks and quarters, the diagram shows the dynamics of changes in the metrics for the selected period:

In other cases, the diagram shows the ratio of quantitative or percentage indicators in the selected period:

When you hover over the chart, you can see the exact figures.
The header contains the metrics displayed on the chart. Any column of the table can be displayed on the diagram, but the maximum number of indicators is 7. Click the metric to hide it.
Data table
The table contains quantitative and percentage indicators by traffic sources. Description of metrics can be found below.
Metrics are grouped based on the report settings. Depending on the details of the grouping, the table structure may have nested elements.
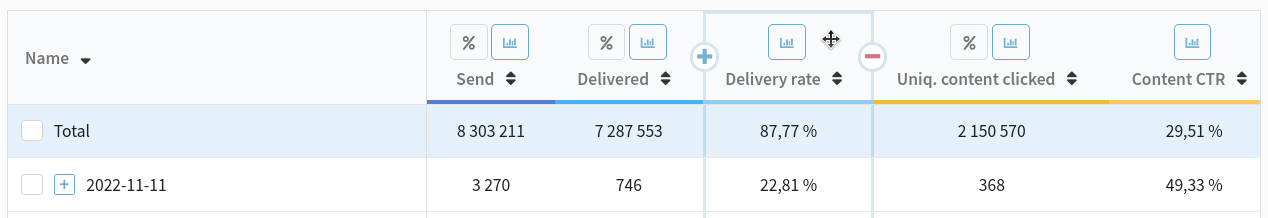
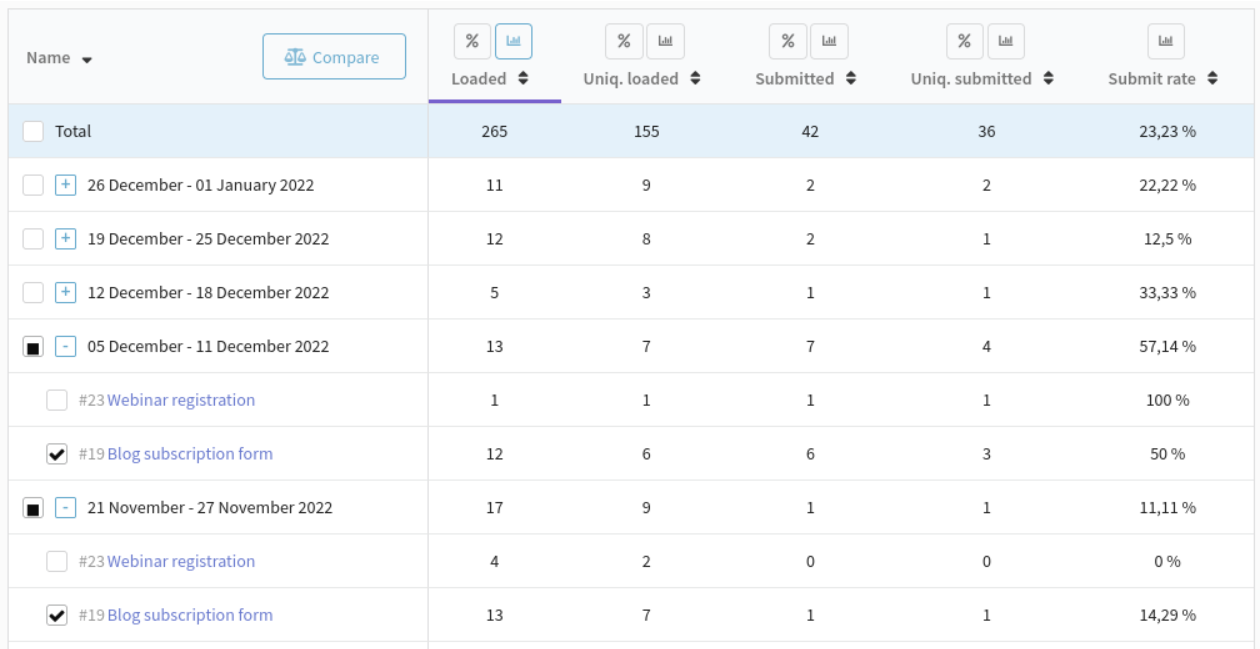
For example, if you set "Group by days, in which to to show Pixels, in which to show* Pixel goals", the table will display the following data:

To add a new metric to the table, hover over the column name and click  . Select a metric from the list. If you want to remove a column, click
  .
.
To move a column to another part of the table, you need to hover over the column name, hold down the left mouse button and drag the column to the desired position.
Other options:
 — switch quantitative metrics to percentages;
 — display a column on a chart.
Comparing data
The comparison mode allows you to see data on several objects at the same time. For example, you can compare the performance of two templates or evaluate the change in mailing metrics from period to period.
To switch to the comparison mode, select the objects in the table that you want to compare. Click "Compare". It is possible to compare objects at different nesting levels.
The comparison mode also contains a chart and a table with metrics. In the diagram, the metrics for each object are grouped together.
The first object in the table is the comparison column. Other objects are compared with this object. The percentage increase or decrease of the metric is calculated relative to this object. To change the comparison column, click  and select a different object.

To go back to the general mode, click ← Comparison mode.
The Altcraft platform allows an inaccuracy of 0.02% when generating reports.
Report metrics
| Report by | Metric | Description |
|---|---|---|
| Channels | Opened | The number of messages opened by profiles. |
| Uniq. opened | The number of unique message opens. If the same profile opens a message multiple times, only one unique open is counted. | |
| Unsubscribed | The number of unsubscribes from resources in all channels. | |
| Subscribed | The number of subscriptions to resources in all channels. | |
| Confirmed | The number of clicks on the confirmation link (link with the confirm-link attribute). | |
| Hit | The number of clicks on a link within a message. | |
| Uniq. hit | The number of unique clicks on a link in messages. If the same profile opens a message multiple times, only one unique hit is counted. | |
| Pixels | Hit | The number of goals registered by pixels. |
| Uniq. hit | The number of unique goal registrations. If a target is registered multiple times for the same profile, only one unique hit is recorded. | |
| Goal value | The sum of the values of all goals registered by the pixels. | |
| Value per hit | (Goal value / Hit) * 100% | |
| Forms | Loaded | The number of times the form page was loaded. |
| Uniq. loaded | The number of times the form page was loaded by a profile. If the same profile loads the form multiple times, only one unique load is logged. | |
| Submitted | The number of successfully submitted forms. | |
| Uniq. submitted | The number of unique submissions. If one profile submits the form multiple times, one unique posting is recorded. | |
| Submit rate | (Uniq. submitted / Uniq. loaded) * 100% | |
| Fill time | Duration of interaction with forms (in seconds). The time spent by each profile filling out the form is summed up. | |
| Pop-ups | Hits to targeting | The number of times the conditions for the popup to appear, specified in the trigger, were met. However, the popup might not be shown to the user due to tag limits specified in the "Activation settings" and "Limits" blocks. |
| Shows | The number of times the popup has been shown to users. | |
| Uniq. shows | If a popup is shown to a user multiple times within the same session, only one unique show is recorded. | |
| Uniq. CTA | The number of clicks as long as there are no fills, or the number of fills if there have been any. | |
| Closed | The number of clicks on the close button (closeButton). | |
| Uniq. closed | If a user closes a popup multiple times within the same session, one unique closure is recorded. |