Popup analytics
Description
Analytical tools allow you to view key popup metrics (hits to targeting, shows, form submissions), as well as user responses. The data is presented in the form of a graph and a funnel. You can group any metric based on various criteria, such as user geo-data, browser, or UTM tags.
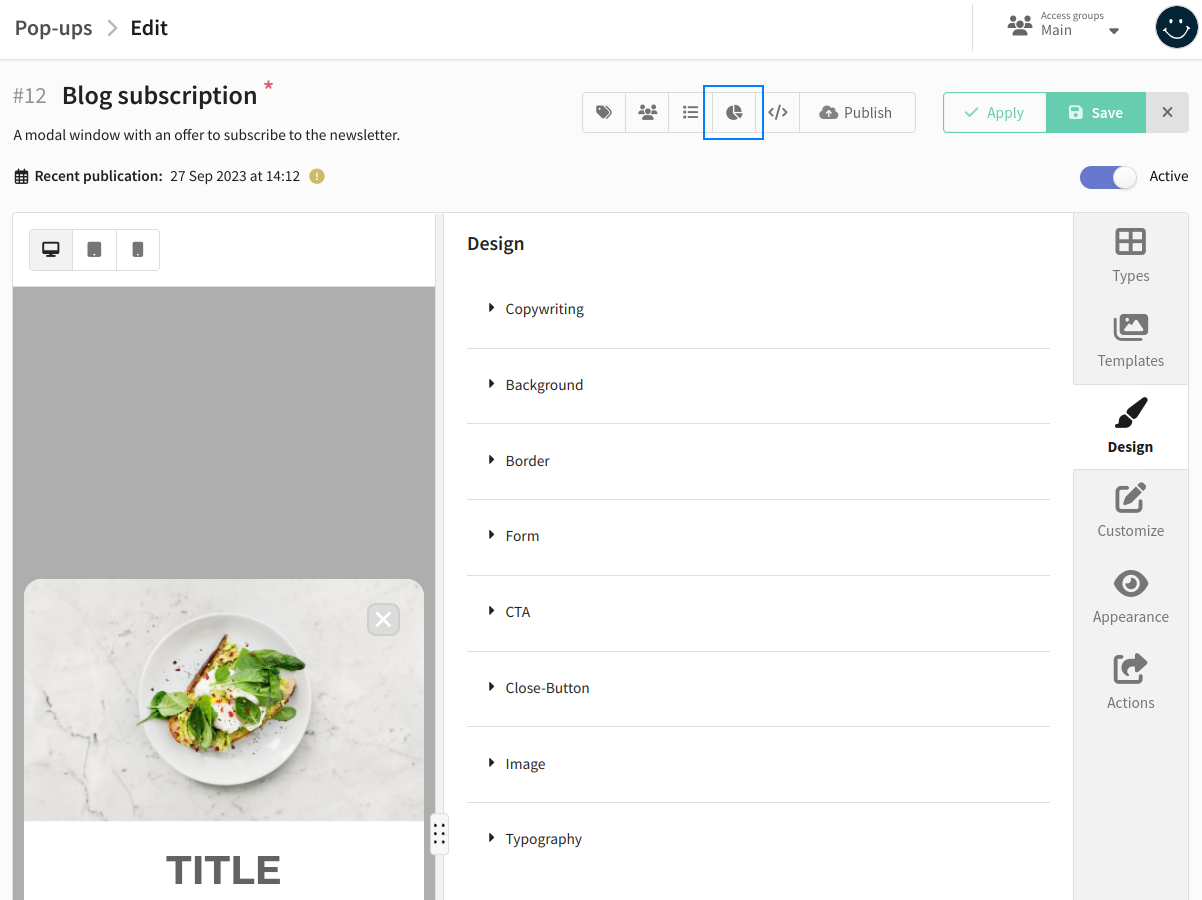
To go to Analytics, find the popup you need in the general list and click on the icon ![]() :
:

You can also go to Analytics directly from the popup editing window:
There are two tabs available in analytics:
- Popup statistics — general summary of the popup.
- Analysis of results — statistics on filling out fields in the form.
Popup statistics
This tab contains information about popup impressions and form fillings. On the top panel you can specify the period for which you want to receive data.
Popup statistics are divided into three blocks:
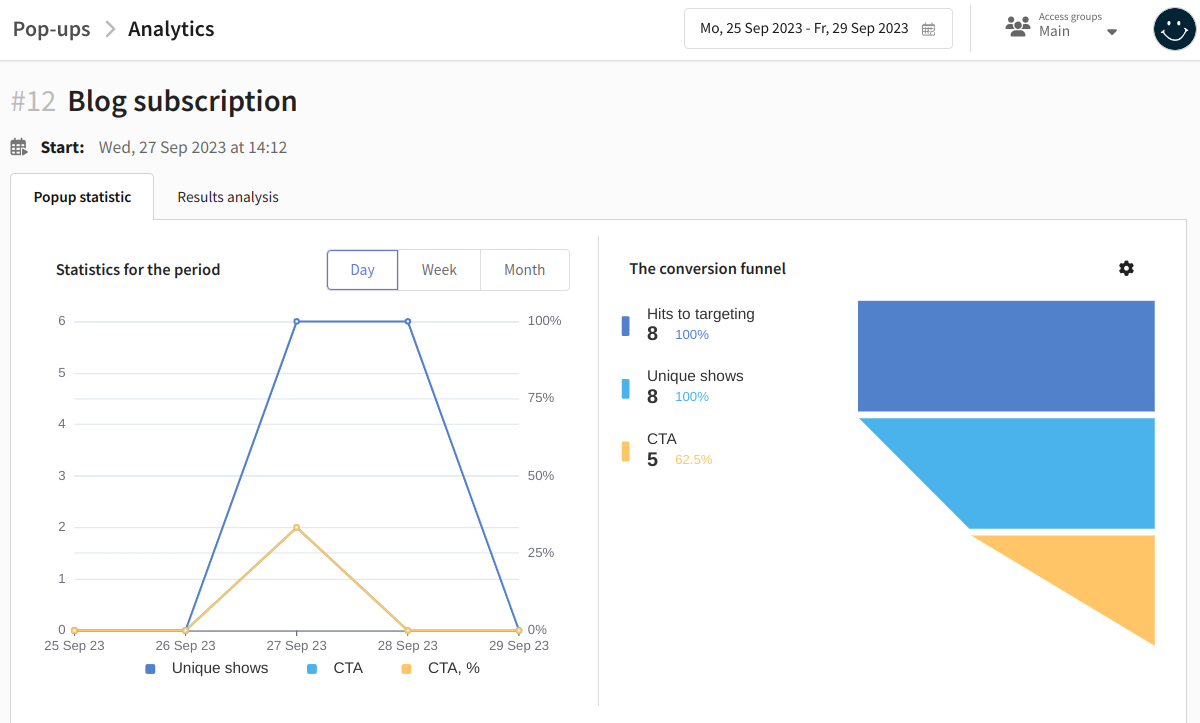
- Statistics for the period
- Conversion funnel
- Analytical slices
Statistics for the period
The graph displays the dynamics of performance metrics over the selected period:
-
Unique shows — the number of times the popup is displayed to users. If the popup is shown to a user multiple times within one session, only one unique show is recorded.
-
CTA — until a form submission event is registered, this metric reflects clicks on any form element. Once the form is filled out and submitted at least once, the metric reflects the number of submissions.
-
CTA, % — (Unique shows / CTA) * 100%.
Data can be grouped by days, weeks, or months. If you want to hide a metric from the graph, click on its name."
Conversion funnel
The funnel is a sequence of steps through which a group of website visitors passes. This group is defined by the first step of the funnel — hit to targeting. The report then shows how many users moved to the next stage. With each step, the number of users decreases.
-
Hits to targeting — the number of times the conditions for the appearance of the popup, set in the trigger, were met. However, the popup might not have been shown to the user due to tag limits specified in the "Activation Settings" and "Limits" sections.
-
Unique shows — the number of times the popup is displayed to users.
-
CTA — until a form submission event is registered, this metric reflects clicks on any form element. Once the form is filled out and submitted at least once, the metric reflects the number of submissions.
Events in the funnel are unique. For example, if a popup was shown to a user multiple times within one session, only one unique show will be counted.
Additionally, you can customize the funnel to suit your tasks. To open the settings window, click ![]() in the top right corner.
in the top right corner.
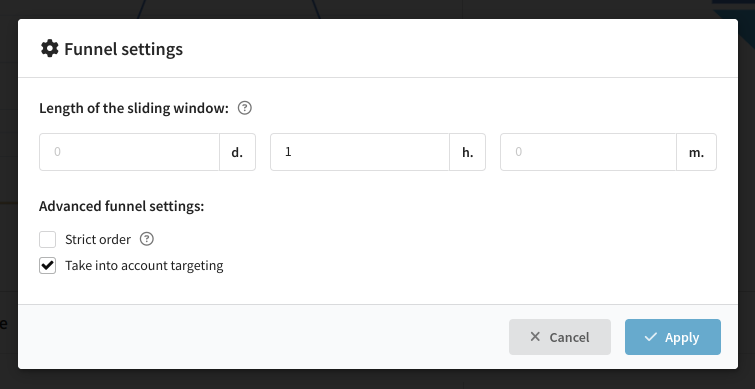
Sliding window width is the time period between the first and last conditions in the funnel. Default is 1 hour. If more than 1 hour passes from the moment you hit the target until the CTA event is registered, then the last step of the funnel will not be counted.
Strict order prohibits extraneous events in the desired sequence. For example, if in a funnel with the sequence Targeting hit —> Unique. display —> CTA between the first and second step one more event will be recorded, then all subsequent events will not be counted. In this case, the event that violated the order will also not be counted.
Take into account hitting the target — by unchecking the checkbox, you will remove hitting the target as a funnel step.
Analytical slices of the report
Below are pop-up indicators grouped by the following criteria:
- By time zone
- By city
- By country
- By language (browser language)
- By OS (operating system on the user's device)
- By browser
- By referrer (URL of the page on which the popup was shown)
- By UTM tags (content, medium, source, mailing, term)
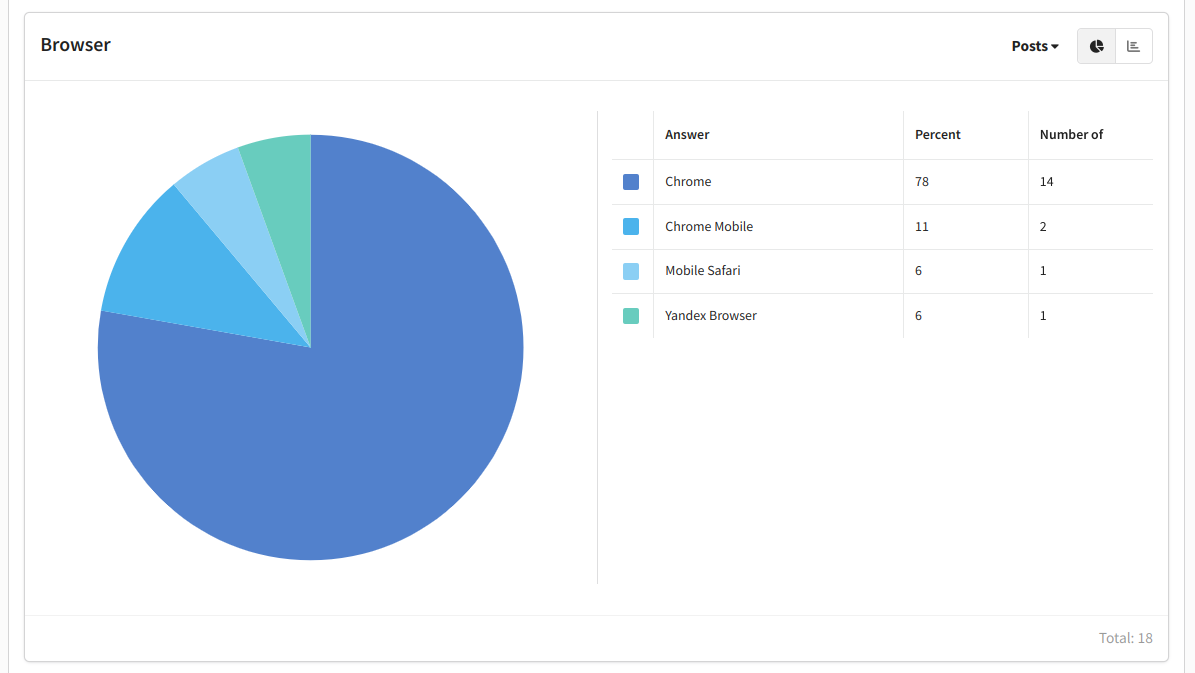
For any slice, you can select a specific indicator:
-
CTA — while the form submit event is not registered, the metric displays clicks on any form element. If the form has been completed and submitted at least once, the indicator will change to "Completions".
-
Fillings — the user filled out and submitted the popup form.
-
Impressions — the popup is shown to the user.
-
Unique impressions — the popup is shown to the user. If a popup was shown to a user several times within one session, one unique impression will be counted.
-
Close — click on the close button in the popup.
In the table on the right, the data is presented in percentage and quantity. The bottom of the block shows the total number of times the selected event was registered. Additionally, you can change the way the data is displayed:
![]() — pie chart
— pie chart
![]() — bar chart
— bar chart
Analysis of results
On this tab you can get information about filling out form fields in the popup:
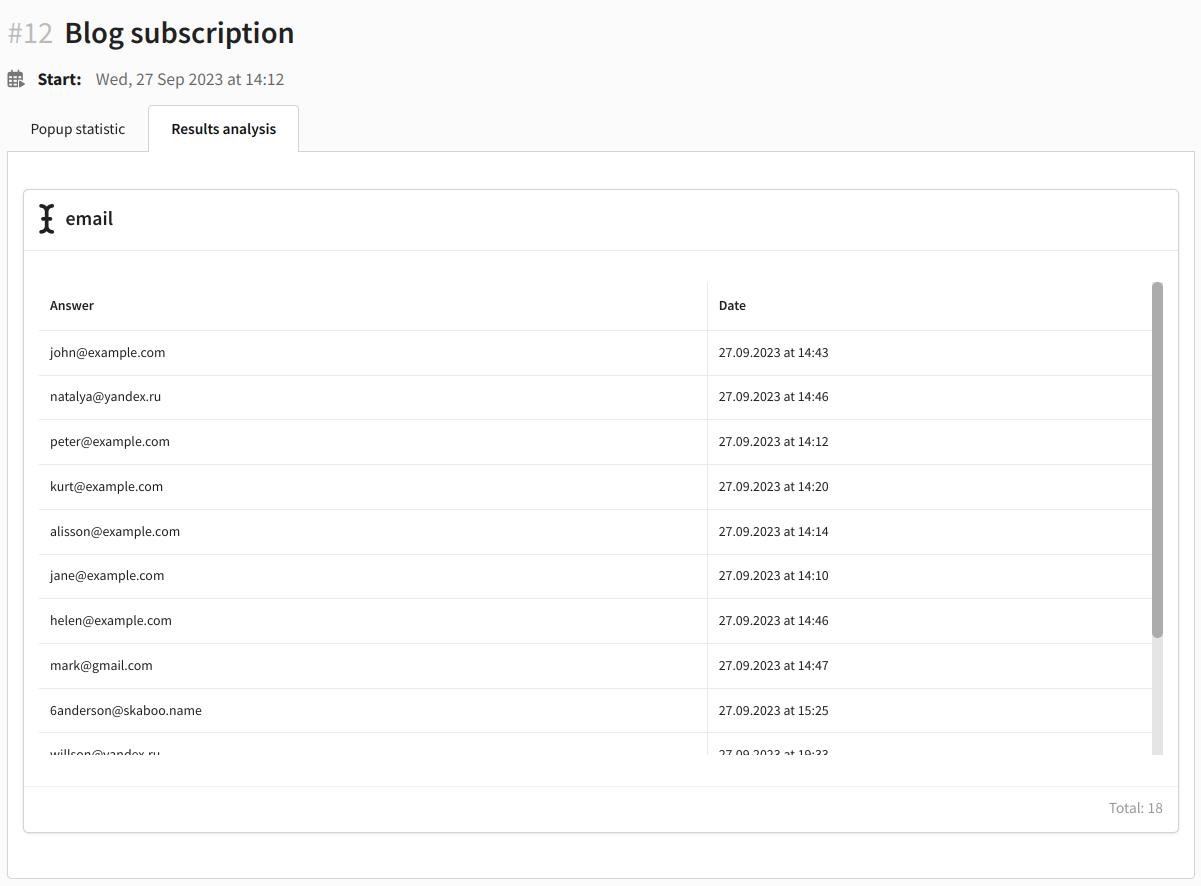
Statistics are generated depending on the type of input field specified in the popup code: <input type="<field_type">. To collect statistics correctly, you should set the type attribute, the value of which will correspond to the type of input data. You can read more about input fields in this article.