Summary report
The summary report is no longer supported. It is not available in versions 65 and higher.
Description
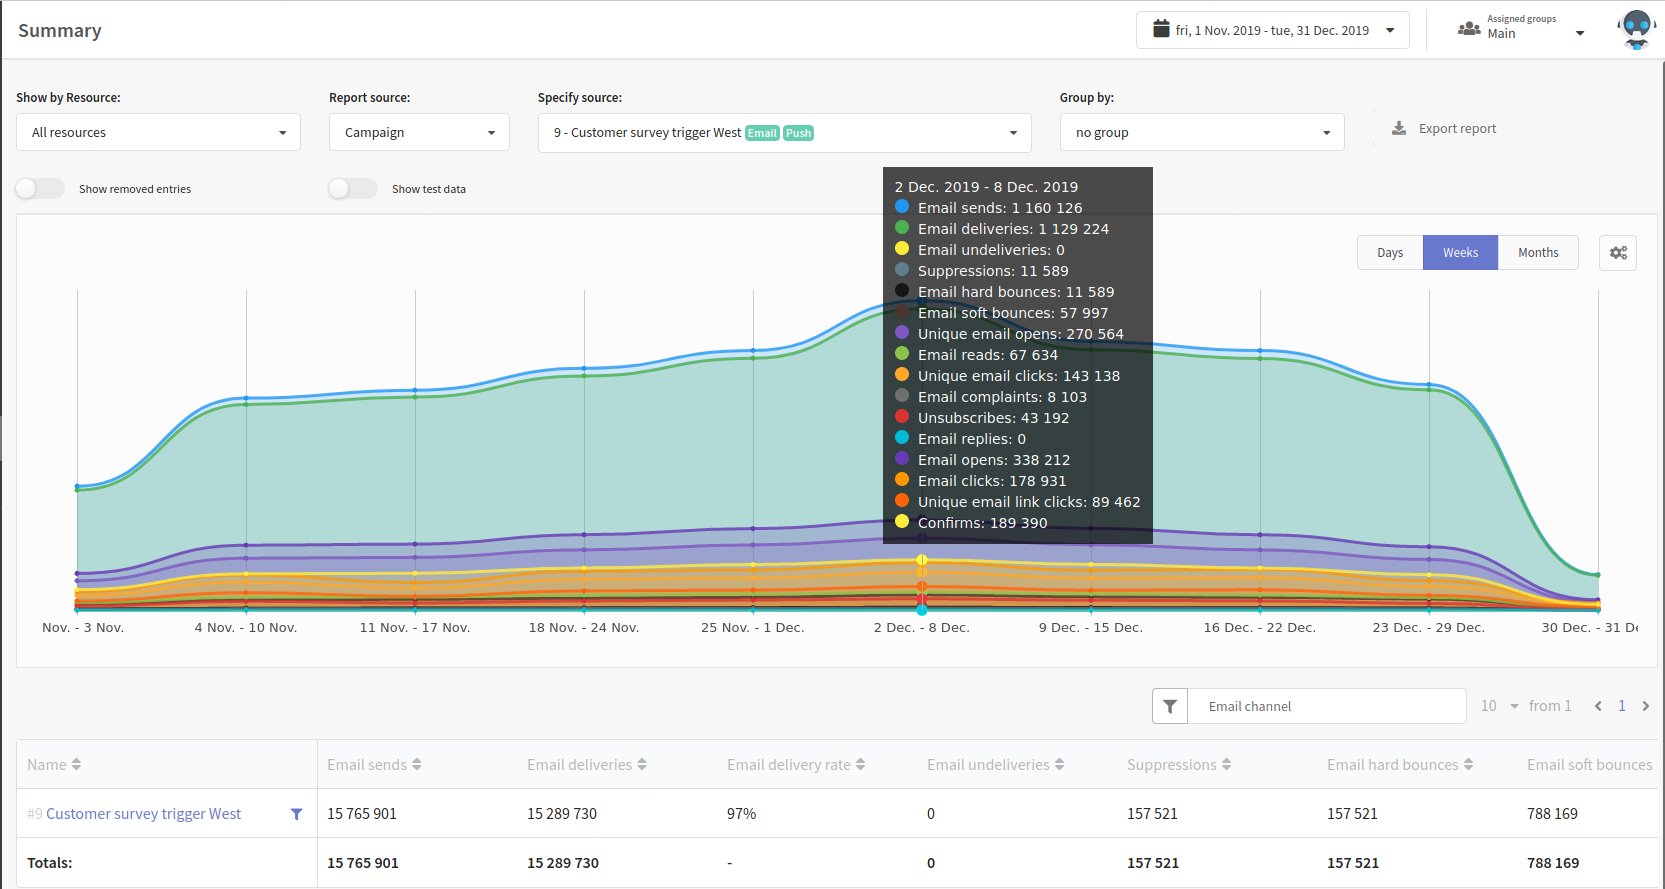
A summary report is the basic tool for detailed marketing campaign analytics. It gathers campaign statistics from the moment when messages are sent, including absolute numbers of opens, reads or clicks as well as relative parameters like delivery rate, open rate or click-through rate.
Moreover the summary report then merges selected campaigns to provide you with a summary of your marketing efficiency, represented as an interactive graph, where you can see your over-time messaging dynamics and get insights on possible communication improvements.
The Altcraft platform allows an inaccuracy of 0.02% when generating reports.
Managing summary report
You can start working on summary report from resource selection in Show by Resource menu (1), or display report by all resources.
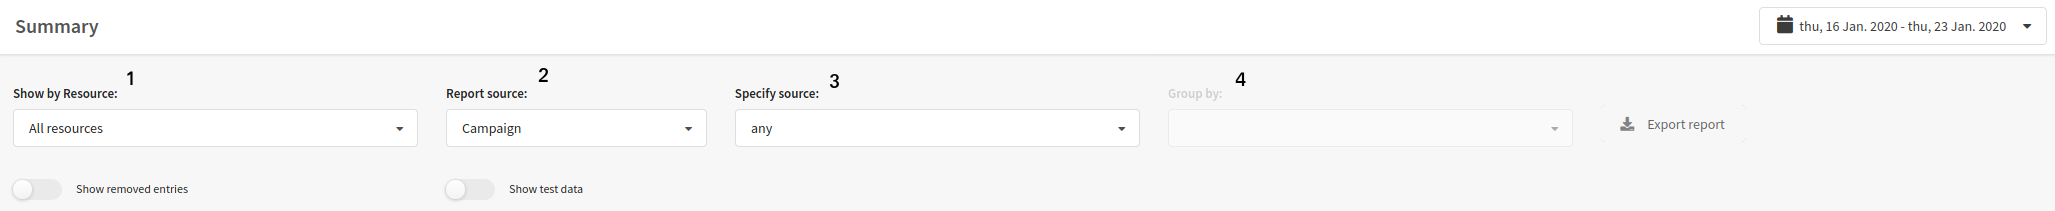
Next, you can select Report source(2). The following options are available:
- Campaign
- Scenario
- Database
- Segment
- Message template
- Resource
- Domain group
- Domain
- Vendor
- Day
- Week
- Month
- Environment
- Sender
Using Specify source menu (3), you can build diagram using information from the menu 2, except domain, day, week, month, environment:
Using next Group by menu (4), you can group report by:
- Domain
- Domain group
- Database
- Segment
- Message
- Resource
- Push provider
- Vendor
- By day
- By week
- By month
- Environment
- Sender
Next, you can select time period for the report.
You can download configured report in XLS or CSV formats.
Also, there are two options — Show removed entries and Show test data.
Show removed entries — includes removed information into the report
Show test — includes test mailings into the report
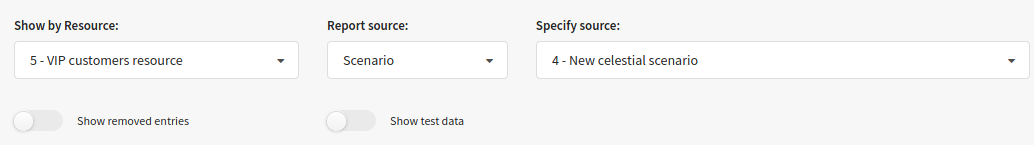
Summary report by scenarios triggers
Select report by Scenario to see detailed statistics by all campaigns within automation scenario.
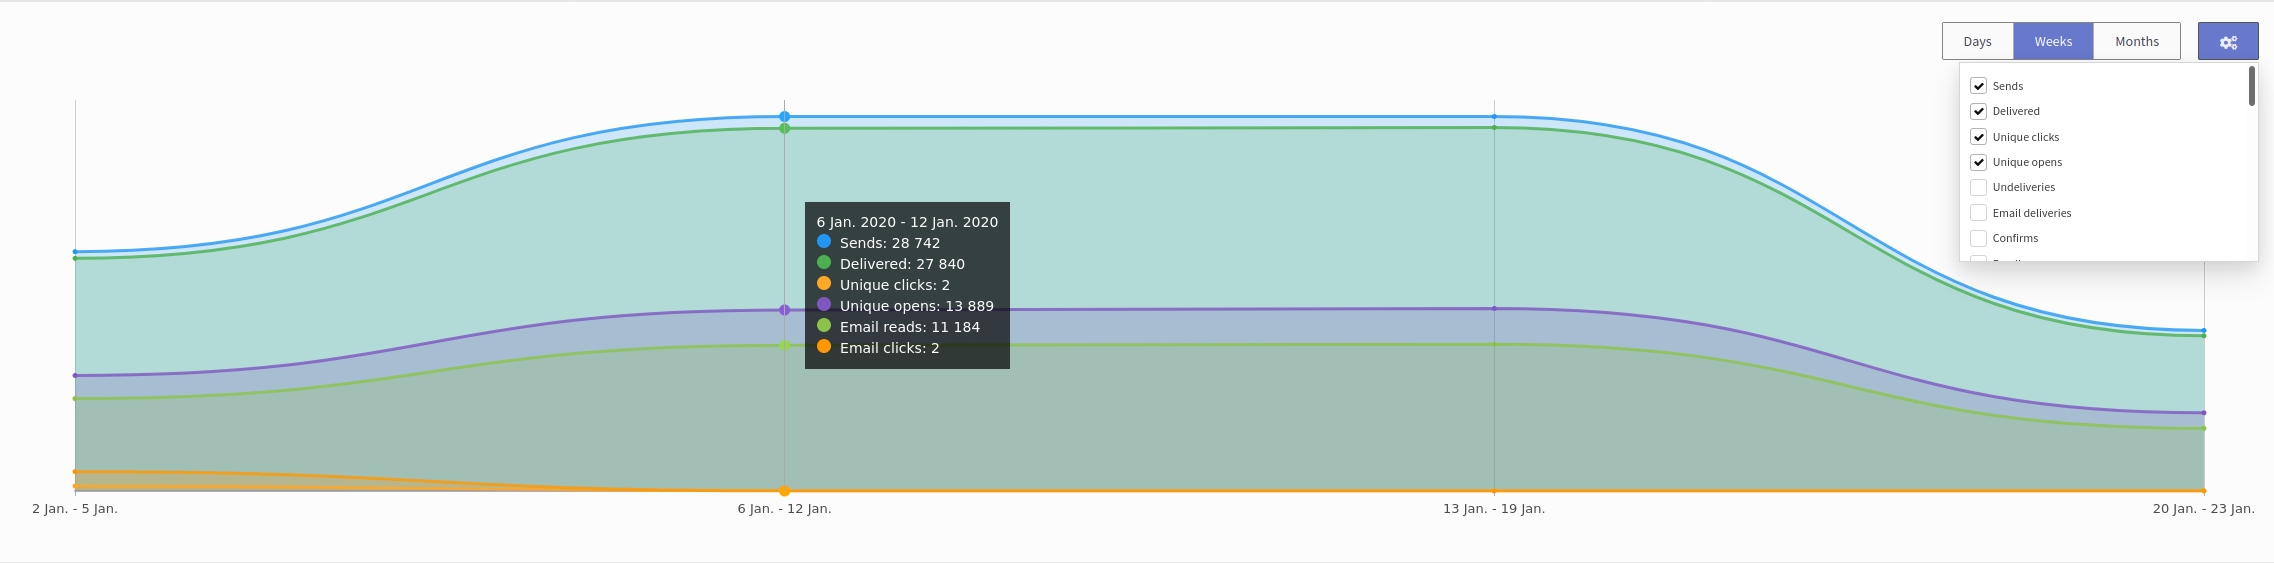
Diagram
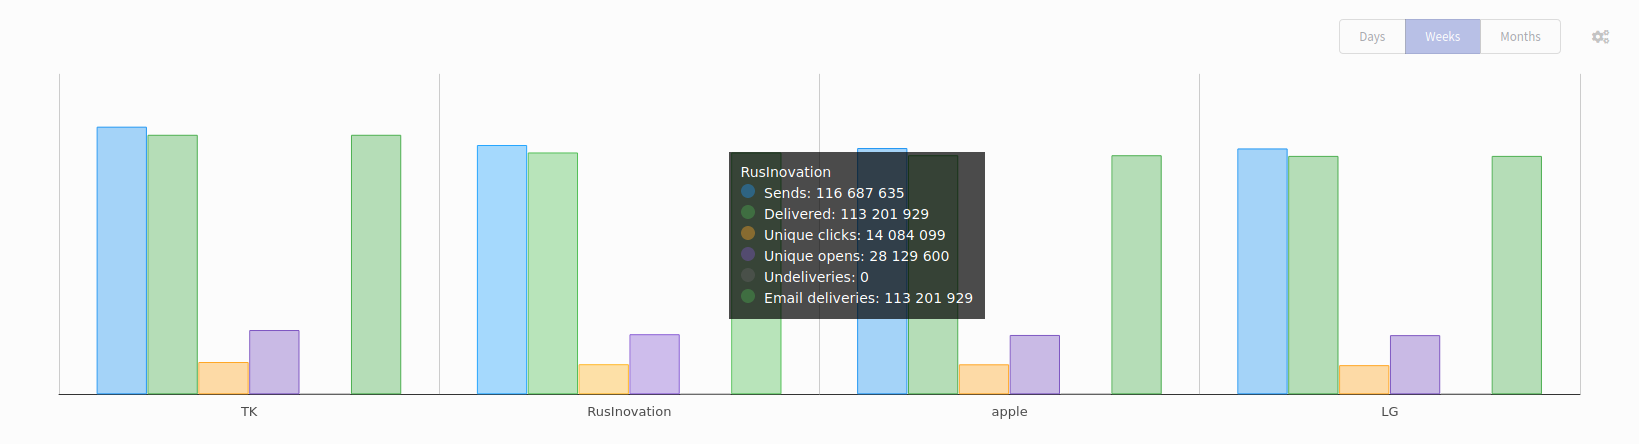
You can select information for display in the diagram by "gear" buttons. Also, you can see diagram for day, week, or month.
For domain groups, domains, vendors and environment, diagram is displayed in columns.
Performance indicators
You can select values for display in table in Select column settings menu. You can use presets or select values manually. Numbers in the table show amount of actions.
If you need more information about values of the summary report, you can read "Summary report metrics".

You can filter data in the table by tag, which allows to improve search.