Goals report
Description
Goals report are a report of how your clients have completed targeted actions and the value of taking them. In other words, goals report displays amount of pixels activated by website visitors depending on goals defined.
Goals can be attached to customer profiles using such Altcraft tools as:
- Tracking pixel scripts hosted on site pages and other resources
- Node "Goal registration" in scenario workflow
- Goal Registration API
The report automatically adds up the value of actions with positive and negative values and displays it as a "Profit" indicator.
Managing report
At the top of the page, select the period for generating the report.
In goals report, you can select Report source and Metrics.
There are two available metrics:
- visits — how many goal actions the user performed;
- profit — the sum of the action value.
The report sources:
- pixels — analytics for pixels for which goals are registered;
- goals — analytics for goals registered for different pixels.

You can specify the source: select a pixel or goal to analyze. When choosing a specific pixel or goal, you can also specify Profiles Database — for well-known clients:
You can download the resulting report in MS Excel and CSV format by clicking the Export report button.
Profit dynamics and goals achievement
The goal report graph shows the total number of visits as well as the total profit from the actions performed.
Profile visits give information about pixel activation by subscribers from databases. Anonymous visits give information about customers not from databases.
Goals can be registered for clients whose contact and personal information you do not yet have. Such events are called anonymous. Altcraft distinguishes them from each other based on connection data (cookies). If a client later registers using the same browser, their data is added to the already existing profile.
Using pixel, you can register certain income or another value at the moment of page visit or completing a goal. Summary number of anonymous and profiles visits is summary profit.
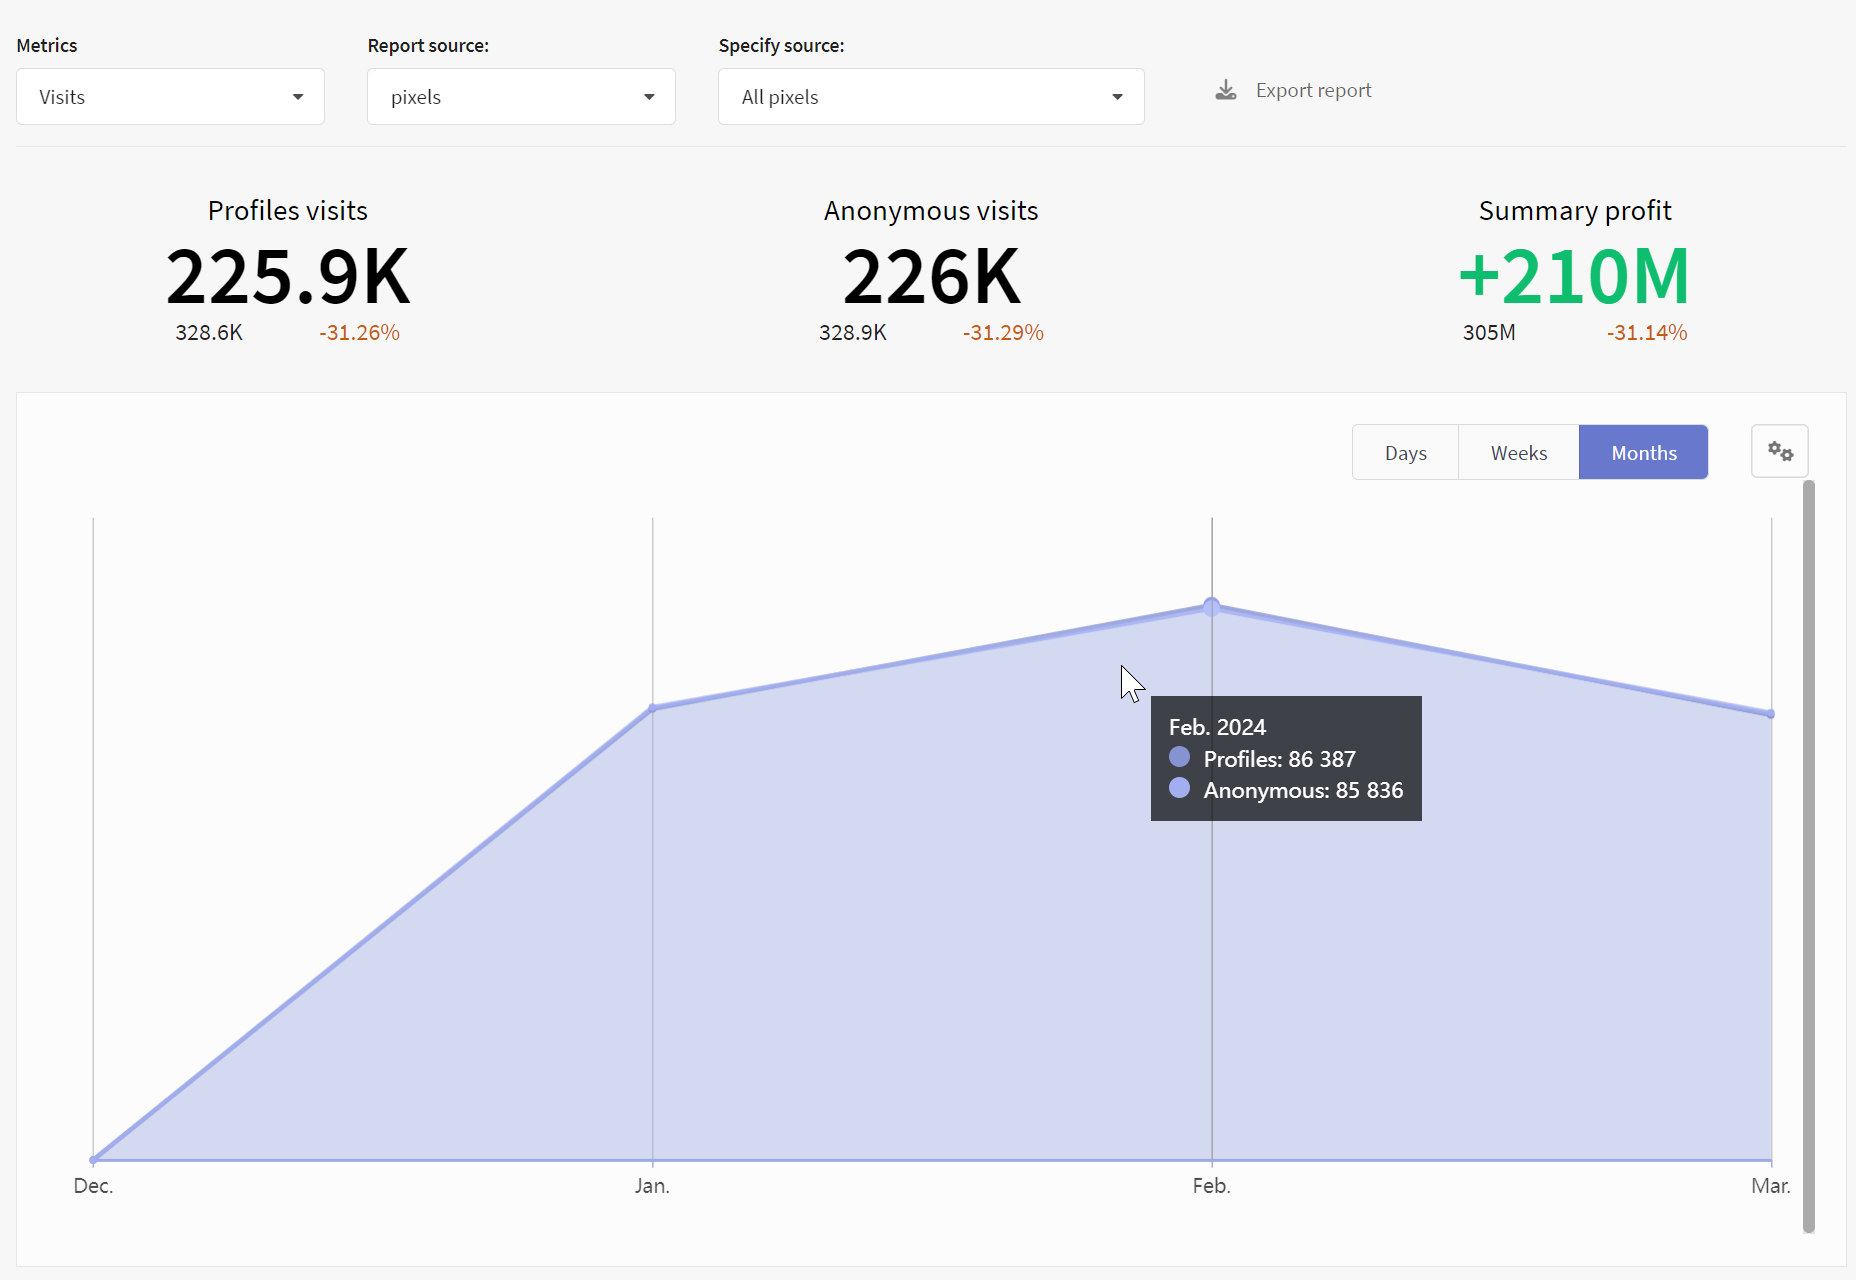
Visits metric
If you select Visits metric, on the graph you can see such information as the number of profiles visits and the number of anonymous visits.
Profit Metric
If you select Profit metric, on the graph you can see such information as summary income, summary expenses and summary profit.
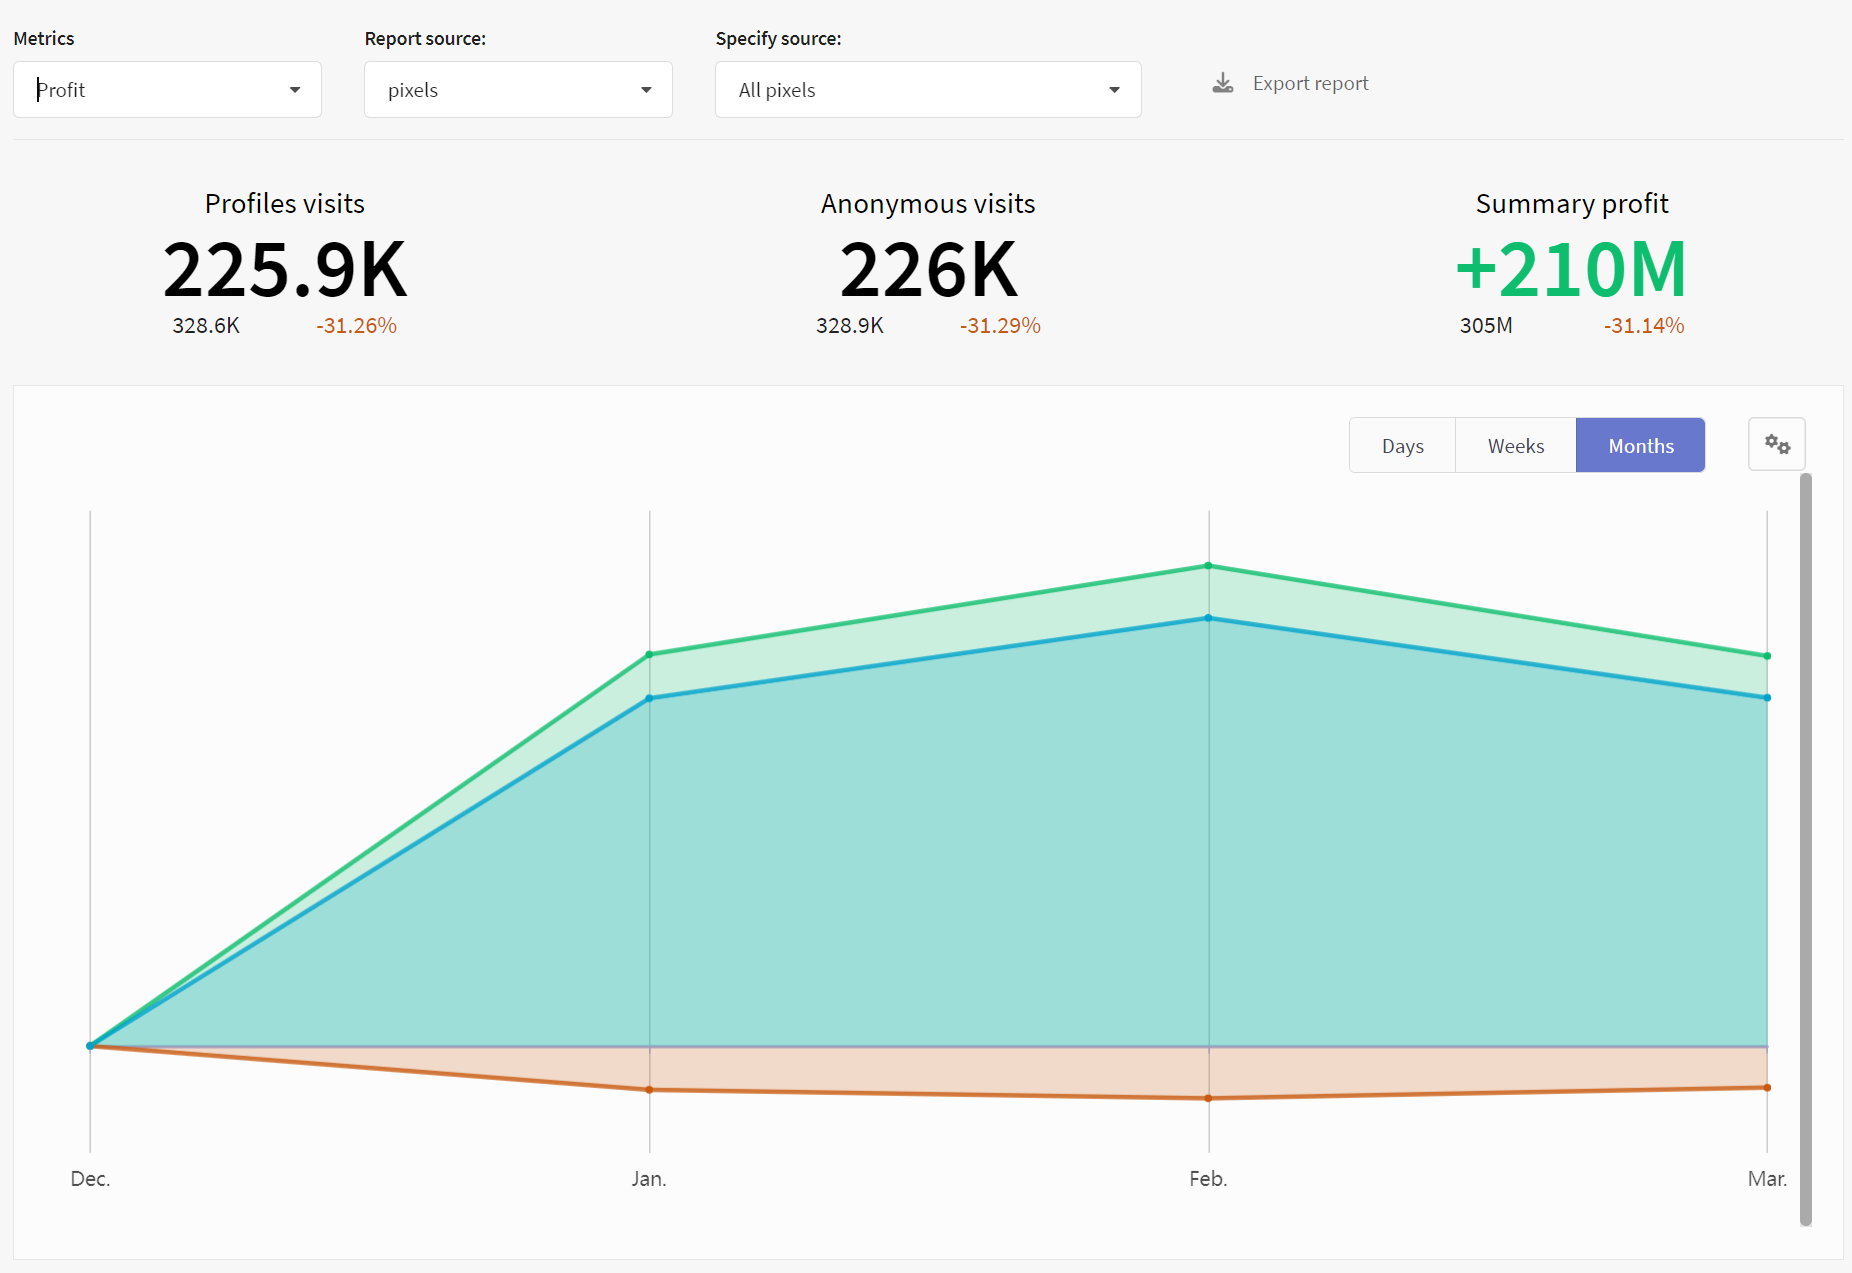
The graph is built by days, weeks or months of the report period. Using the button  , you can remove unnecessary indicators from the chart or, conversely, add them.

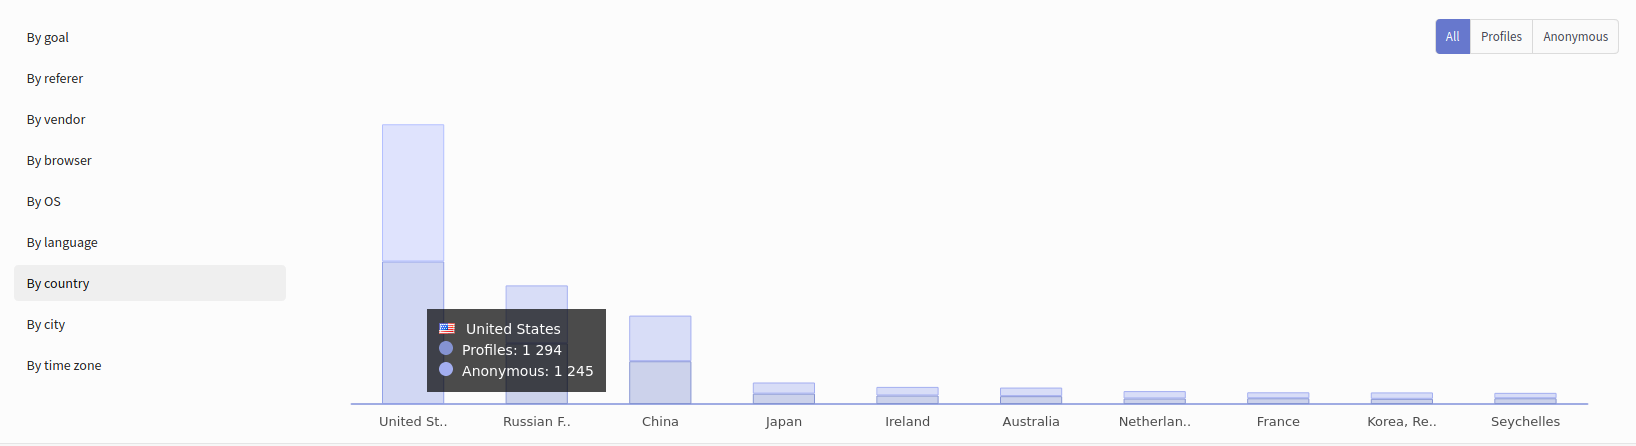
Analytical report slices
When registering a goal action, Altcraft collects information about the device used by the client, as well as about the network connection and referer. Based on this data, you can additionally group the resulting audience:
- By goal
- By referer
- By vendor
- By browser
- By OS
- By language
- By country
- By city
- By time zone
Report indicators
The table at the bottom of the page contains a summary of the report based on the settings, slicers, and metrics you selected. It is this data that will be uploaded during export. Click to add columns to the table or hide unnecessary ones:
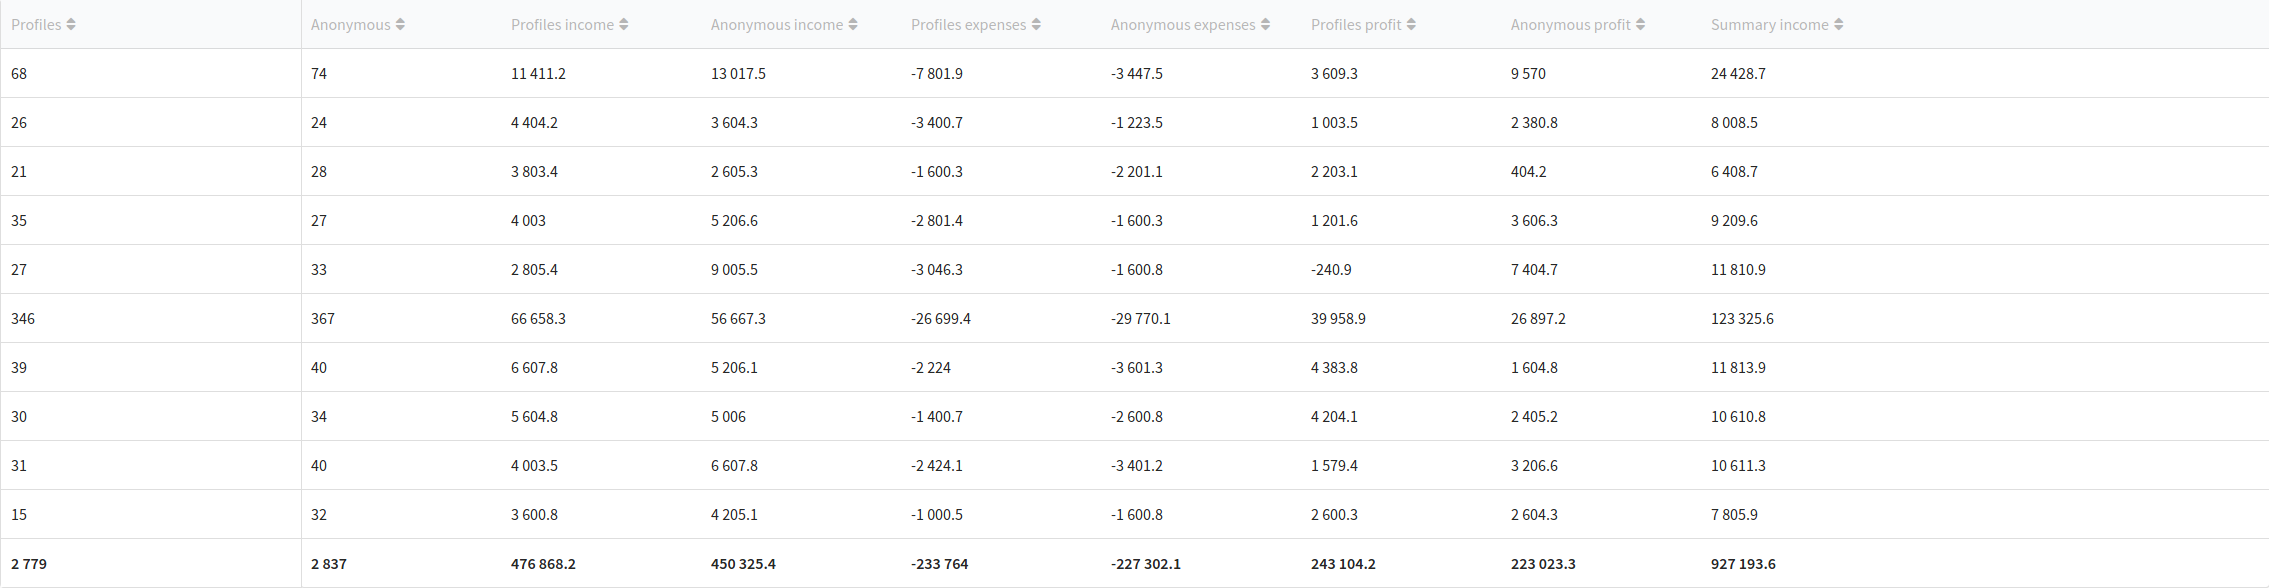
The Altcraft platform allows an inaccuracy of 0.02% when generating reports.