Lifetime report
Description
Customer lifetime report is an accurate tool to analyze customer cohorts lifetime. Lifetime here indicates client message activities like opens or link clicks.
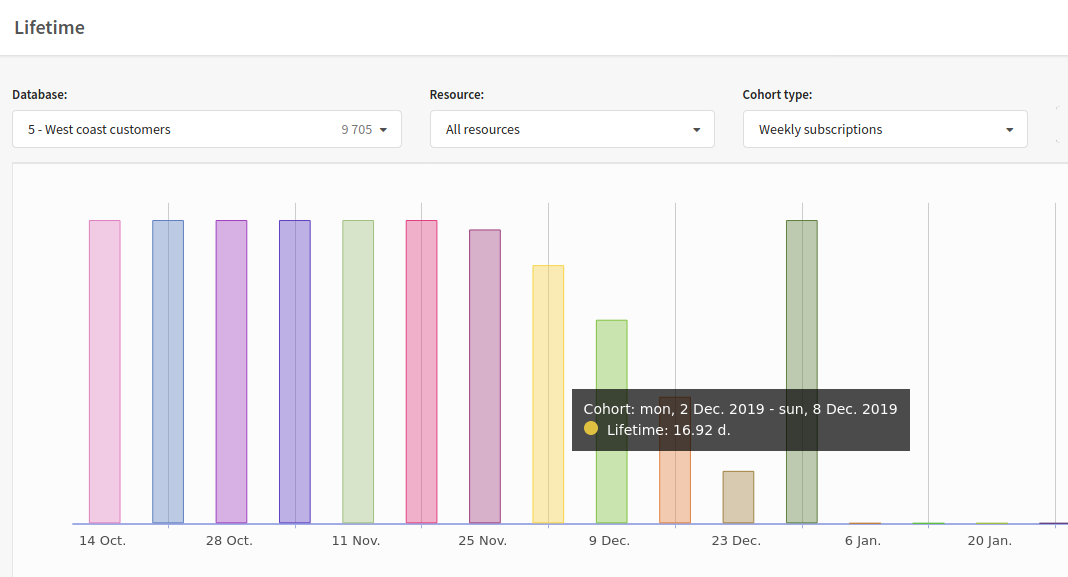
Graph columns represent average subscriber activity time for the specified subscribers cohort.
- A maximum clicks per day amount for a cohort is retrieved.
- Then all other days results are divided by this maximum number. Thus relative value for each day is retrieved.
- Then the relative results are summed to form an average customer lifetime, measured in days.
- If a day's result is less than 5% of a cohort maximum it will be skipped.
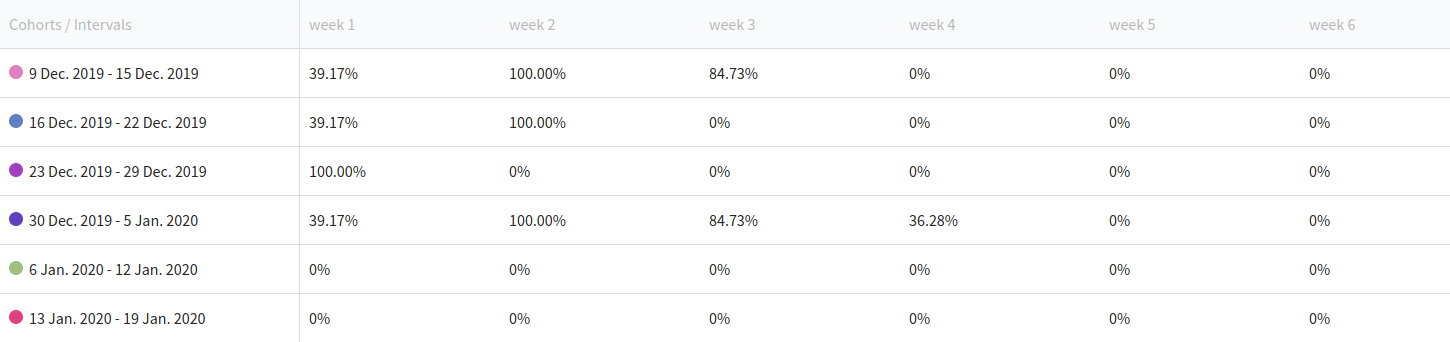
Cohort activity values in lifetime report table represent a relation between a specific time period and the period of maximum activity.
General settings
To calculate certain cohort lifetime, select database first.
After this, you can select resource. Also, you can select no resource, and lifetime report will be counted for all resources.
You can also select cohort size - monthly or weekly.

In cohorts columns, you can see sequence of decreasing clicks amount by each week and decreasing interest to sent messages.
To the right of the settings is the Export report button, with which you can download data in XLSX or CSV format.
Table
You can see ratio of clicks amount in one cohort to general amount of subscribers in cohort in the table.
The Altcraft platform allows an inaccuracy of 0.02% when generating reports.